Ultimate
Distribution View (Chart View)#
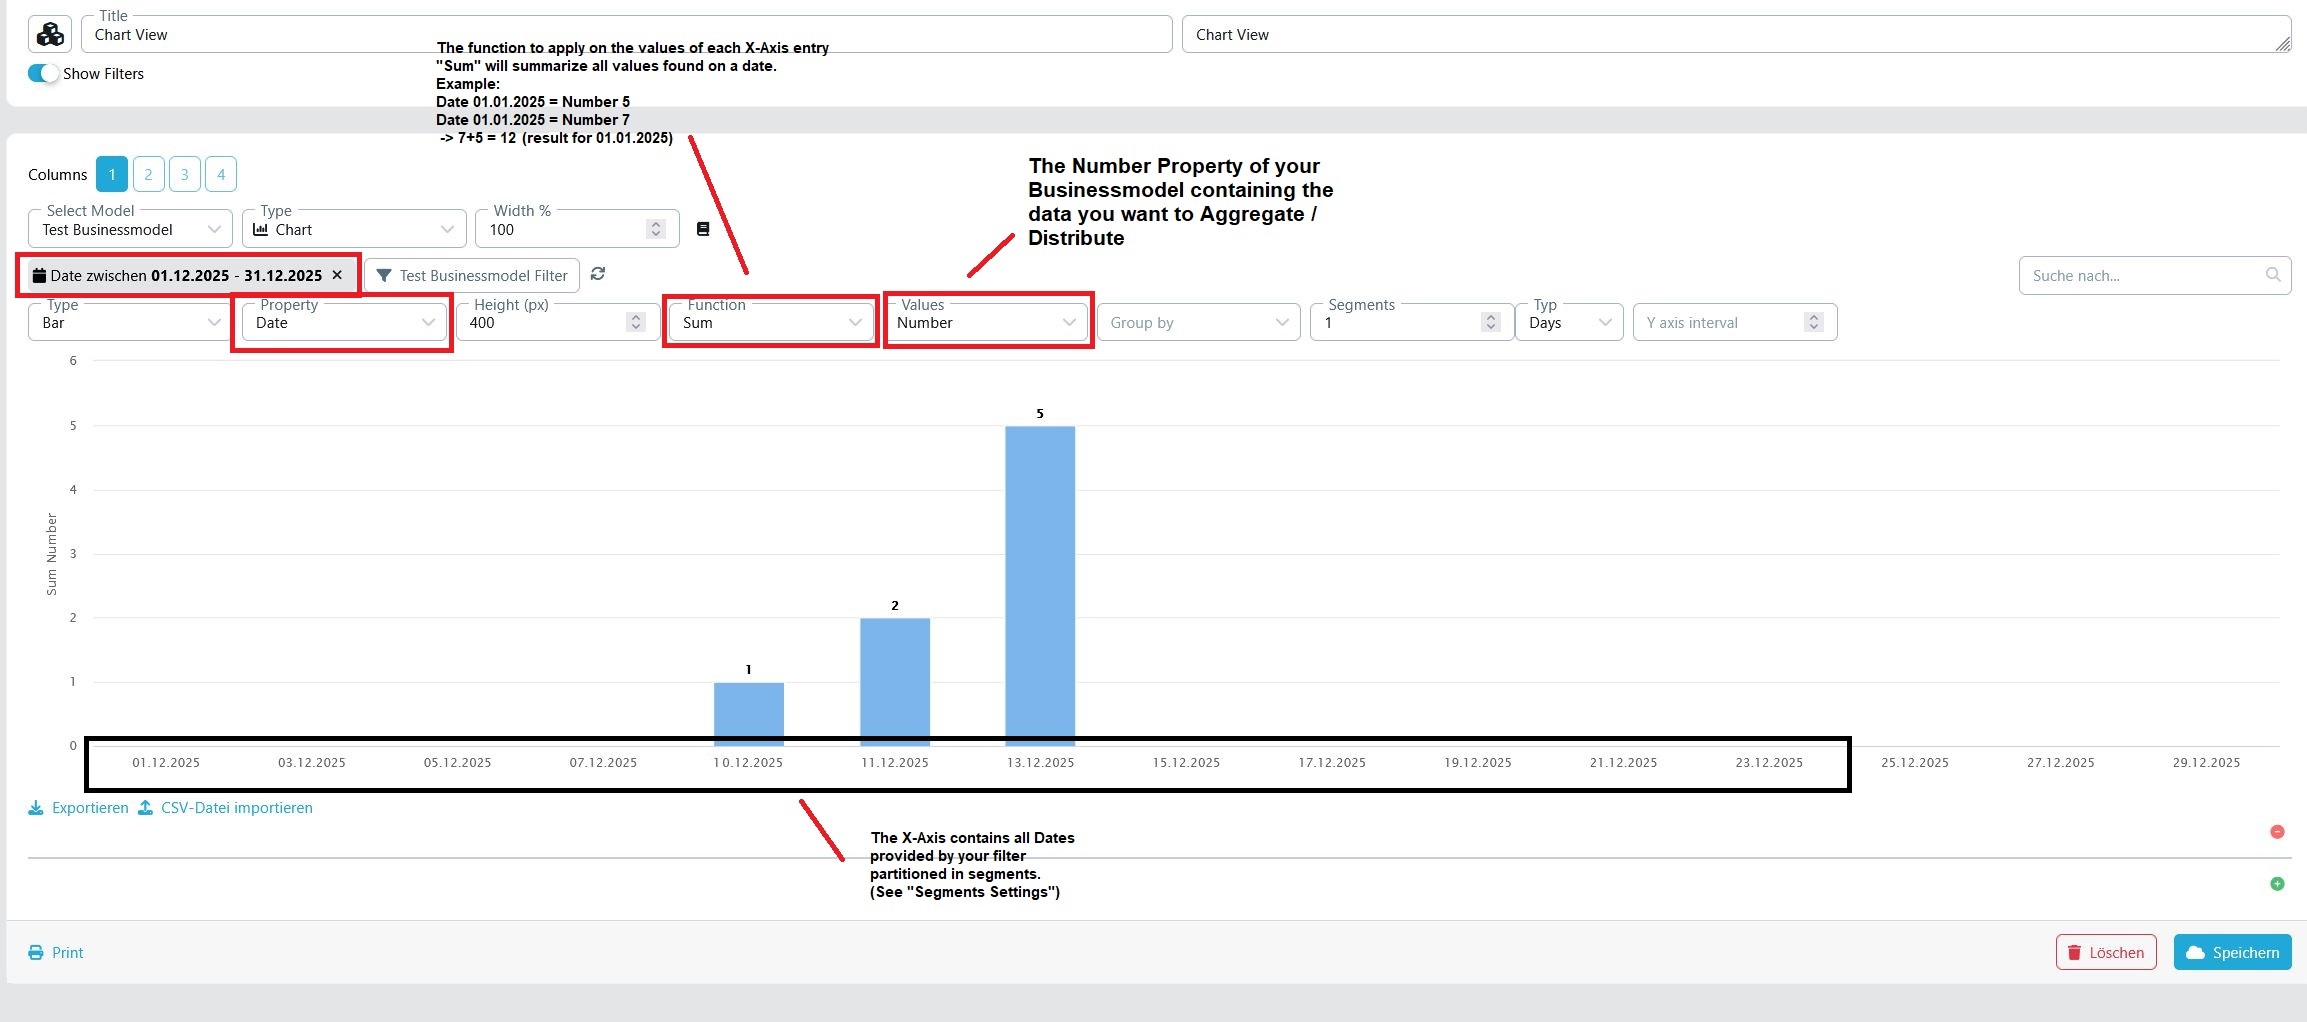
Visualize business objects on a chart using a Number, Date, or Timestamp property.
How it works#
- Property: Pick a Business Model property (Number/Date/Timestamp) to plot on the X‑axis.
- Resolution: Choose the bucket size (e.g., 1, 0.5, 0.01, 100 for numbers, or minutes/hours/days/weeks for time).
Bar Chart Sorting#
When the chart type is set to Bar and the X‑axis property is a Text property, you can control the order in which bars are displayed using the Sort setting:
| Sort option | Description |
|---|---|
| Default | Bars appear in the natural (insertion) order of the data |
| Lowest to highest | Bars are sorted ascending by value (shortest bar first) |
| Highest to lowest | Bars are sorted descending by value (tallest bar first) |
The sort setting is only available for Bar charts with a Text X‑axis property. Number and Date/Timestamp X‑axis types are always shown in their natural numeric or chronological order.
Notes#
- You must filter by the selected Property to build the X‑axis.
- See Views for general view concepts.
Examples#
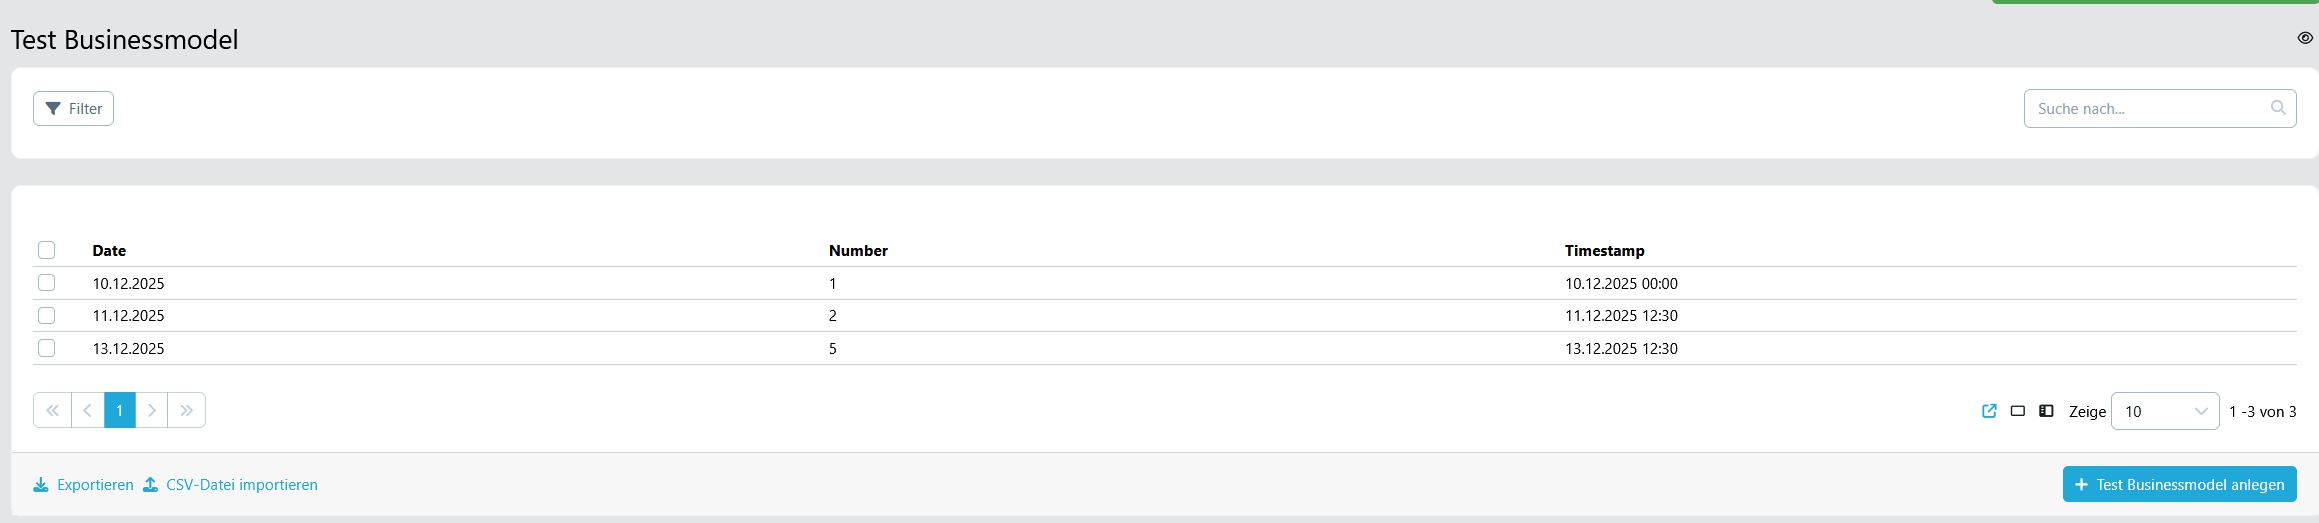
Source data (objects):
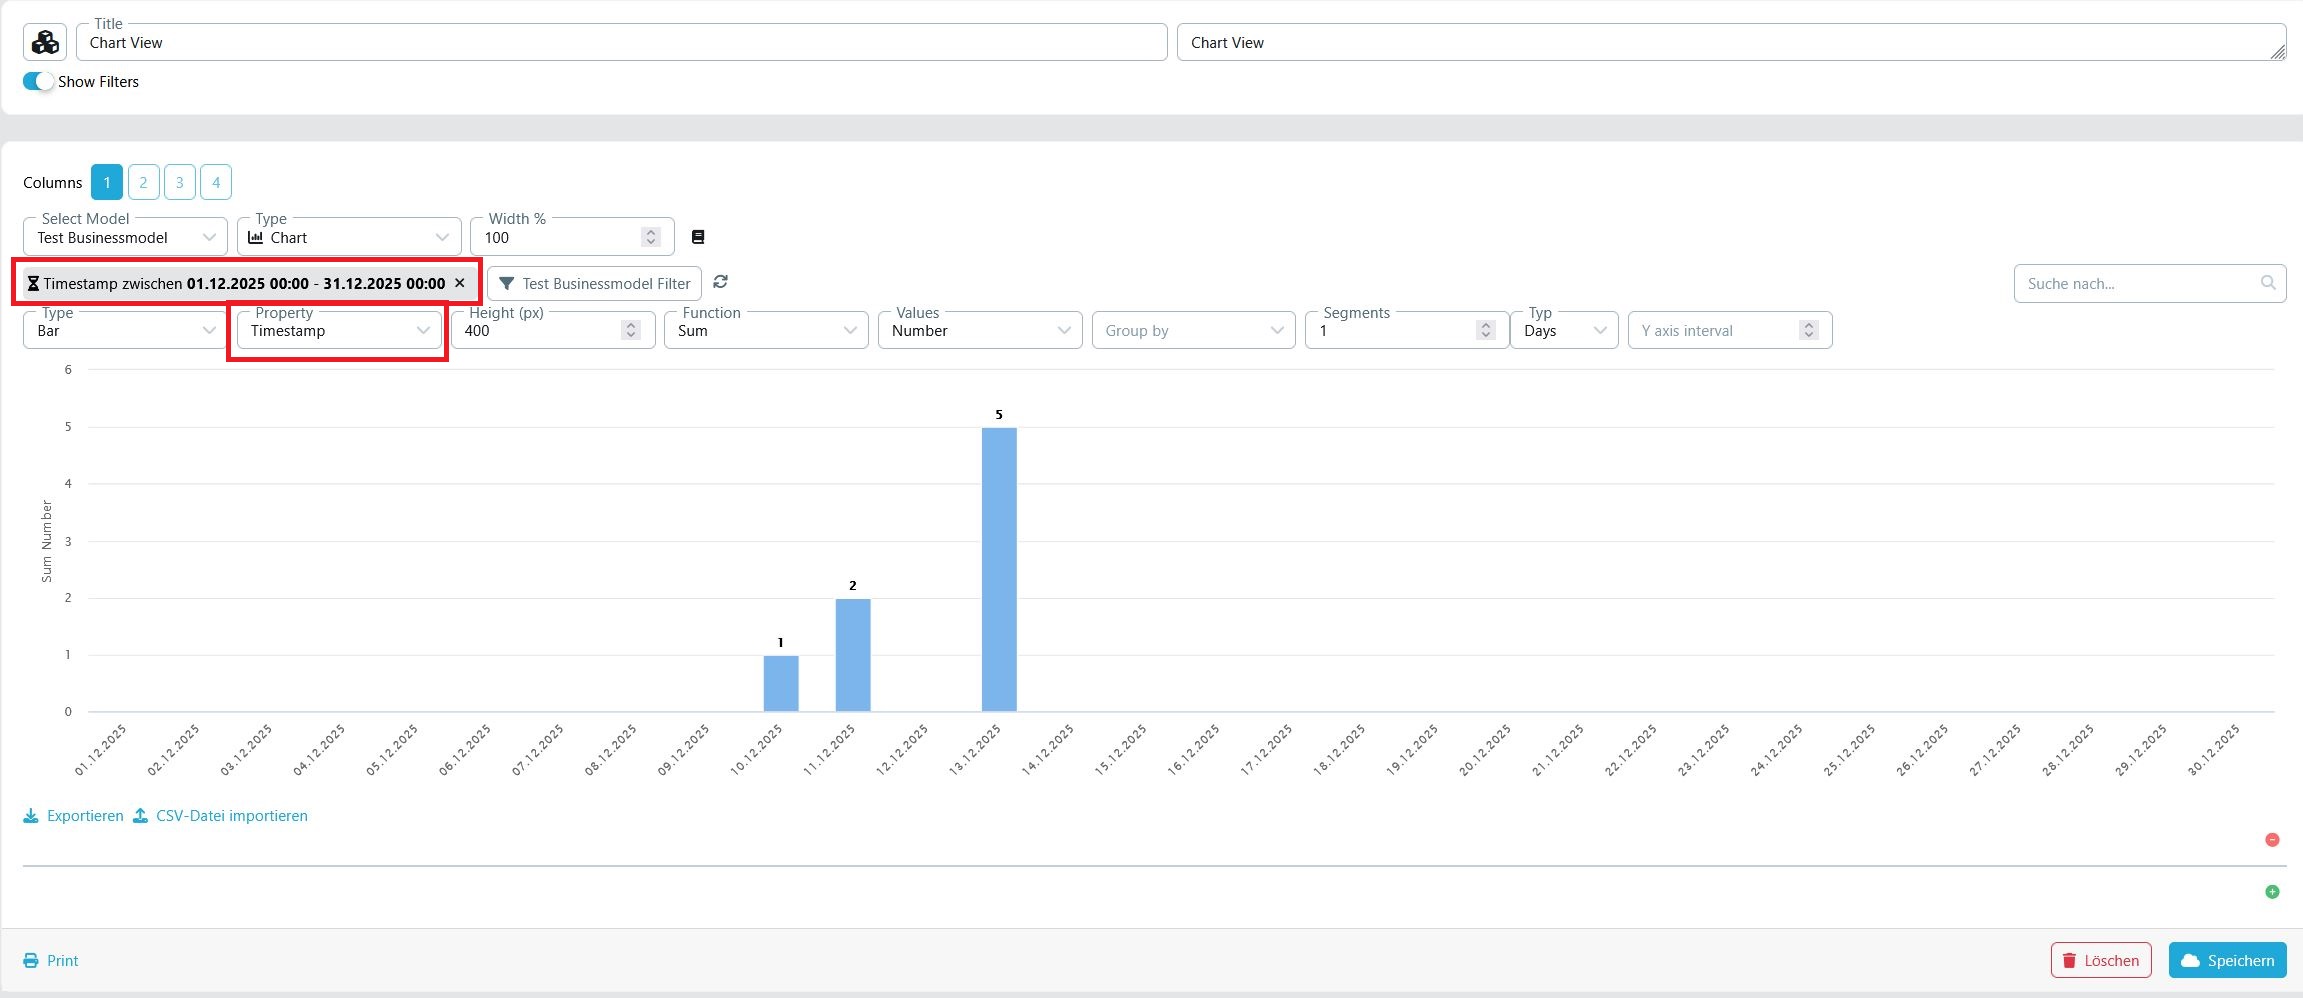
Filter requirement message:

Filter applied (distributed/aggregated):
Using a Timestamp as the X‑axis: