Flow Dashboard#
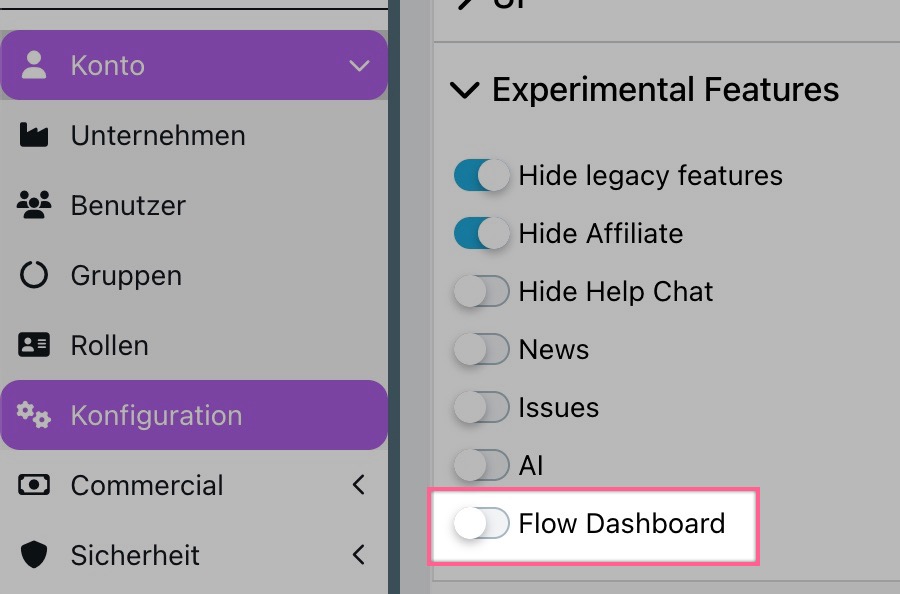
This is an experimental feature. To give it a try, go to Account > System Configuration > Experimental Features > Flow Dashboard to enable it.
The Mobile2b dashboard works with the following assumptions:
CO2 savings#
- Average number of flows with UI nodes: 50%
- Average number of UI nodes per flow with UI nodes: 2
- Average DIN A4 pages per UI node: 1.5
- CO2 savings per A4 page: 0.035 kg
Time savings#
- Average number of nodes per flow: 4
- Average additional effort for manual execution per node: 2 minutes